Global Rates Update #7: Same North Star, Worse Weather
The MoU came and went, the shock starts to broaden out, no one believes the pricing and Gamma is still cheap!

Hello and hope we are all having a great summer so far.
I hadn’t initially planned on spending my Sunday afternoon writing a new blog post.. I had hoped to be a few pints deep getting ready for England to finally bring it home! Alas, we got a lesson in how not to risk manage a position! So here I am.
However, markets have become more interesting again, with many themes to discuss beyond just Iran… But given the recent news flow, we must once again start there.
TLDR:
The MoU came and went... The peace trade got carried out on a stretcher, whilst Energy and Inflation forwards are back close to year highs.
The shock isn’t fading, its broadening. TTF, Wheat, Crack Spreads all look to add fuel to the inflation pressures in the pipeline (PPI/import prices).
CPI was noise not signal. Common component still hot, points to a reversion in the coming prints, and July fixings at 0% look mispriced.
Higher Neutral North Star from #6 unchanged. September is live for the Fed, ECB and (whisper it) the BoE. BoJ still sitting behind the curve, whilst the term premium migrates out. POLL AT THE END
Bimodal pricing across rates means the priced-in path is also the least likely path.. gamma still cheap for the regime its operating in.
The risk for Central banks to stay on hold begins to compounds with time.
Still bearish rates.
The War is just here.
The MoU came and went. It was clear from the outset that an MoU was not a deal. Yet the market had become so lethargic, traders tired, from all the headline ping pong we had seen that it was desperate to trade It like the conflict was fully resolved. And for a moment at least, it did feel like there was some hope. Some Ships were getting out of the Straits, the threat level came down and there was a collective sigh of relief (as well as the resumption of vol selling!) that followed. Trump was taking victory laps with Oil back to $69, risk premiums had diminished, and we were all back talking and positioning “as if it was February.”
The US framing was that the MoU was always contingent. A deal that Iran had to earn its way into. Read charitably, it was a sincere attempt at diplomacy. Read cynically, it was merely used for both sides to breathe, restock and reposition for further action..
Whilst plenty of smaller skirmishes over the past few months, this is no marginal re-escalation... As I write, the conflict is spreading fast. Iran striking Desalination plants across Kuwait & US military bases in Jordan… against which, the US has reimposed the blockade and is appearing to soften the ground by hitting what it deems to be Military relevant targets across the south of Iran.
Unfortunately as it stands, there are clear & visible next steps on the escalation ladder.. Be they strikes on Pickaxe from the US, or activating the Houthi’s from Iran. At the same time, there are no obvious off ramps.
Whilst we learnt from the first round there is a Trump put to all of this. It doesn’t feel particularly close today. We’ve all seen the chart many times. But the Straits appear functionally closed.
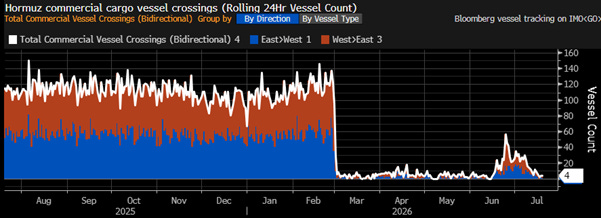
As always, I’ll try and steer this blog away from commenting on the potential paths for the war. It’s the backdrop now, not the subject.. everything trades in its context, and pretending otherwise gets us nowhere...
The consensus unwind.. the pain trade
Markets did a great job of internalising the change in reaction functions from various global CBs (notably the BoE/ECB). With the path for policy becoming a derivative of oil futures. As we discussed when this Change occurred back in #4, it was a prudent step for a CB, with no extra clue than you or me, to take. Based on this, and the also growing consensus that the US economy / Fed was isolated from this relationship.. not only as a Energy exporter, but also with strong tailwinds to growth from other vectors.
It was no surprise then, that come the middle of May, As Oil was starting to peak, and the MoU was slowly forming, that the market rushed back to the very position it had violently stopped out of in March.
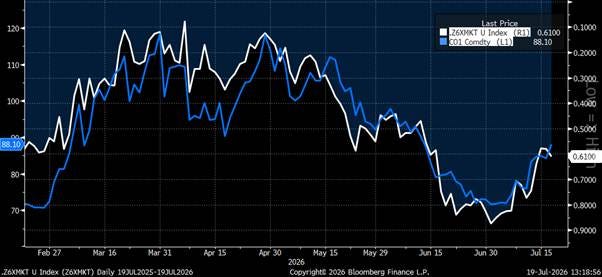
It wasn’t the higher neutral trade I’d been looking for dominating flows.. It was the peace trade..
The fast money book coming into early July, as best I can piece it together from flows and the price action, was one of paid USD rates against received EUR and GBP (with the periphery.. SEK, PLN, CZK etc.. bolted on for carry/beta).
A tidy structure with a neat narrative: America’s nominal engine runs hot with hikes, Europe’s energy shock fades with the war, the ECB’s June move gets remembered as a mistake, & the BoE somehow never goes at all…
Strip that exposure down, and put even more simply.. PC1 of that book was merely an short on the energy complex..
Bimodal pricing and a reminder that the path to higher neutral rates will never be plain sailing.
There’s a market structure point underneath this that I think explains why the move so far has felt so painful, and it’s worth making explicit.
Markets, for the most part, price off the probability weighted distribution of outcomes.
And the distribution of views out there right now is no simple bell curve centred around what’s priced in. It’s more like a barbell.
One camp, id argue still the majority, firmly believes there is no cycle at all.. that the shock will fade, inflation is merely transitory and any hikes that we’ve seen are a mistake..
The other camp believes we’re in the foothills of a proper repricing and eventual delivery of monetary policy tightening.
Think of the 50bps of pricing as a 50% chance of 0, and 50% chance of 100bps.
And so, whilst we price somewhere between those two camps depending on the vibes or news du jour, almost nobody actually resides at the midpoint…
So what’s priced, is almost the least likely path. We can observe this from looking at SOFR vol. Looking at specific landing zones for US rates come Z6, we see that the pin structure around .31 (I.e. Rates unchanged) is currently the richest point. This is quite a different look at expectations than the “31bps priced” to Dec…
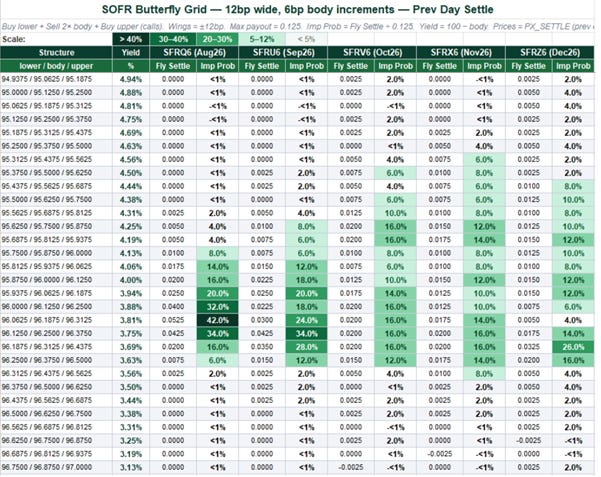
And so, In this bimodal world, every data point isn’t slowly nudging a consensus along a clear path, it’s trying to arbitrate between two polar opposite worldviews, meaning the priced in path snaps from one mode to the other...
It’s a further reason, as I tried to argue in 6.1, that gamma is becoming increasingly attractive in this world… Not only do we have the ability to snap between bigger states of the world. We have one set of rates curves decidedly linked to energy (and thus the whims of our dear leaders) and the USD curve, who under Warsh will be giving no clear forward guidance.
What gives me confidence however, that we are on the path to higher neutral rates is a subtle form of price action that I’ve noticed in the past few weeks.
Firstly in EUR, then last week in USD. Post sintra, the market somehow interpreted ECB language that September was unlikely to be a hike.. It’s certainly not how I interpreted it but Sep Gap got to 11.. however, at that time the belly of the curve started to twist steepen. Almost as if, the curve itself knew that the policy mistake was to remain on hold.
We subtly saw it once again after CPI. July FOMC had gone from around 9-12bps beforehand and then quickly down to 3.. yet by the time I came into work the next day, 2y1y was pre CPI levels.
To me its clear that the market does not just “want” rate hikes.. but it “needs” them. So as before, and my north star remains unchanged..
But its no longer just Iran that is pressuring the system.
The broadening supply shock
The market has mostly focused on Oil futures for its direction so far. However there are 3 developments that have happened in the past few weeks that are worth looking at.
1) TTF / Gas
Firstly, As any EUR rates trader knows, TTF is actually far more relevant than Oil for European inflation. And it does not paint a pretty picture.
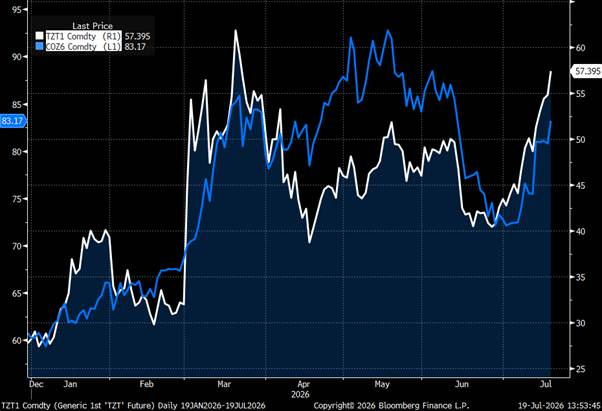
TTF is trying to clear three unrelated crises at once.. Iran is the obvious one.. the blockade lands directly on the LNG flows Europe was counting on to refill storage. LNG is harder to re-route out of the straits given there is no scalable pipelines like there is for Oil. Escalation clearly serves to pressure Gas prices, and targeting LNG facilities in Qatar etc is likely only a few steps away if we continue on the path we are currently on. Problematic, sure. But its not just that.
Stacked on top of this, the Rhine has fallen to levels that are disturbingly low for early July, & weeks before the traditional low of the season. Kaub, the chokepoint that sets the draft for every barge, broke below the level (I eyeball it at about 1metre from the chart) at which commercial shipping starts operating in emergency mode. Lo and behold, barge transport rates roughly tripled.
That’s oil products, coal and chemicals all getting more expensive to move through the industrial heart of Europe… Further juicing demand for Gas / TTF that may be increasingly less available on the global markets.
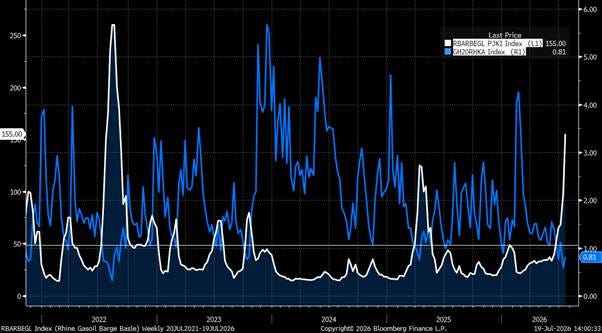
This chart shows barge freight costs (white) vs Rhine levels in Blue. Everytime Rhine drops, barge costs explode. As they are now.
And lastly then there is France, recently experiencing a severe heatwave, taking nuclear reactors offline because the rivers that cool them are too warm to legally discharge into.. briefly taking multiple GW out at the worst time… with the marginal unit of European power reverting, as ever, to gas..
For those of you who remember back to 2022. Yes we saw an immediate spike at the start of hostilities in March. But the real pressure came later on in the summer.
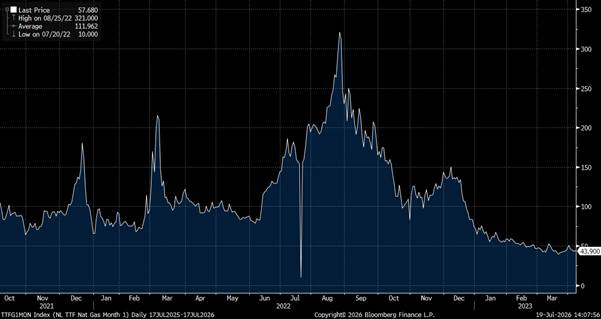
Firstly, and of course coincidentally, we saw pressure on the Rhine, spiking transportation costs and pressuring demand for TTF.
Second, The Ukraine war, which many had only expected to last a few weeks was starting to look like it could continue into the Winter. This was concerning to governments across Europe who had, at the time, no been willing to fill inventories up with the higher cost. At some point however, the mandate changed and Governments were scrambling, out bidding, and chasing gas prices up to fill storage capacity for a decidedly unsure winter that was to come.
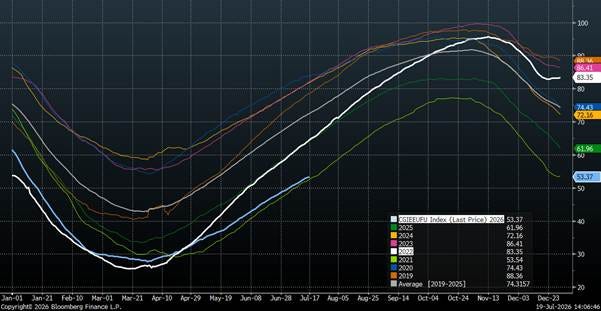
White is 2022, Blue is 2026. We are tracking both a lower total level, and a slower gradient. Much like a Central banker, at some point the job of government is to risk manage the situation. And I’m not sure, as warm as this summer has been, they would be willing to punt that the Winter will be cold..
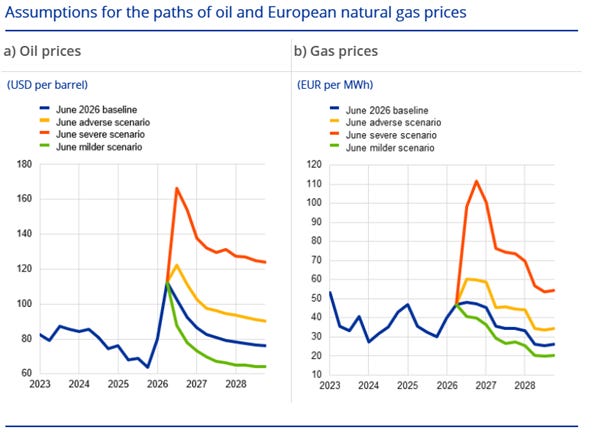
TTF at 57 is tracking much closer to the ECB’s “Adverse” scenario… Pressure is mounting. And look, I am not an energy expert.. But this is at least moderately concerning, and worth paying extreme attention too.
And this is all before talking about Russia…
2) Food prices
I wrote in #6 that one of the key risks to my view was that, unlike in 2022, global food prices were remarkably stable, and if anything were falling. This might be starting to change.
The world seemingly struggles to focus on more than one thing at once. And whilst the Military conflict in Iran has taken the worlds focus. Activity across the Russia/Ukraine front has started to pick up meaningfully in the past few weeks.
Ukraine has done a remarkable job of extending the front line deeper and deeper into Russia. And whilst consistent and growing strikes on Oil refiners has been well documented all year. There has been a stark and recent rise in Vessel strikes across the black sea and Sea of Azov. Whilst the truth is always difficult to know, somewhere between 150-200 Russian vessels, carrying a range of product have been struck since July began. Russia, in retaliation has started striking Odessa port infrastructure and cargo vessels. This new front for the war has clear and obvious implications for global wheat prices. Higher.
Its been 4 years since we were all last Grain experts, so my memory and precision is somewhat hazy. But it is something like 20-25% of Russian Wheat exports transit through the Black sea, and the majority of Ukraine’s. Something like ~30% of the worlds wheat is now transiting through a more active war zone again.
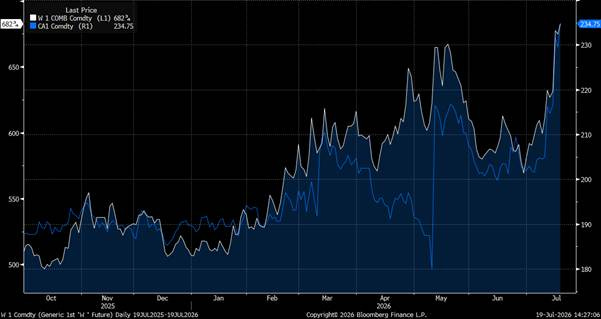
Wheat prices have reached a new year to date high.
Now, this hasn’t escalated to full blown proportions yet, but Wheat futures aren’t waiting to find out. The timing of which is increasingly important as export season is August-> November.
In terms of a global significance. It’s not quite reached the thresholds of being too relevant, but certainly worth keeping an eye on.
BCOMAG, a broader measure is certainly higher, but not yet above the peaks. But as we talked about last time, Food is the largest component in the CPI basket for almost every country. And whilst arguably not as relevant as an input cost to other goods, it is the most visceral form of inflation that humans have to endure.
3) We consume Oil products, not Oil.
This last point is probably the most immediately concerning. We have to always remind ourselves that no one actually consumes Oil. We consume Oil related products.
And as much as it is useful at both a high level and on a daily basis to just observe and follow Brent crude futures. This physical supply shock is reminding us that we need to pay attention to the dreaded “crack spreads”…
This isn’t the place, nor am I the guy who can with detail explain to what extent this will continue, or the obvious ways it resolves itself. I am purely looking at this as a lens to think about upcoming inflation prints and then rates more broadly.
Looking at two crack spreads (A products v Oil), the European and US benchmarks for such things.
- Low sulphur Gasoil vs Brent Crude.
- Gasoline RBOB vs WTI.
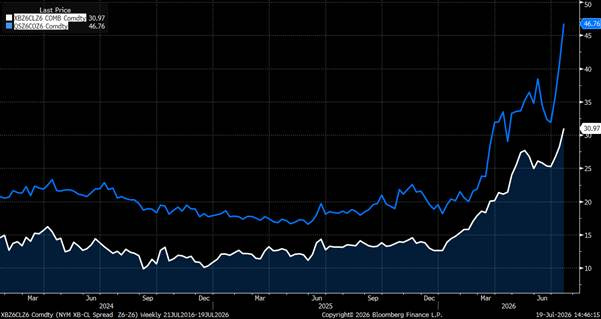
Looking at them in the form of spreads shows you an ugly picture.
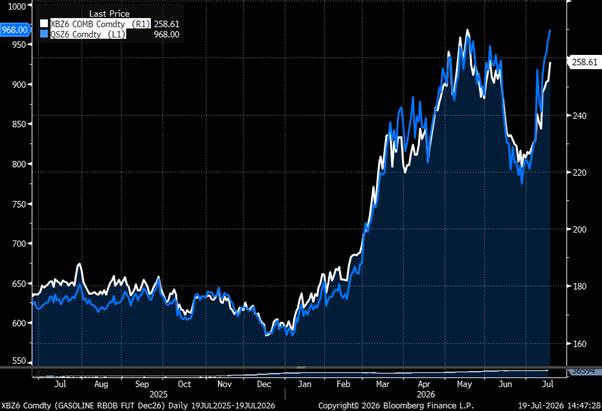
Looking at both in terms of outright is even uglier. And they are both effectively back to the Year to date highs (when looking at Z6 futs).
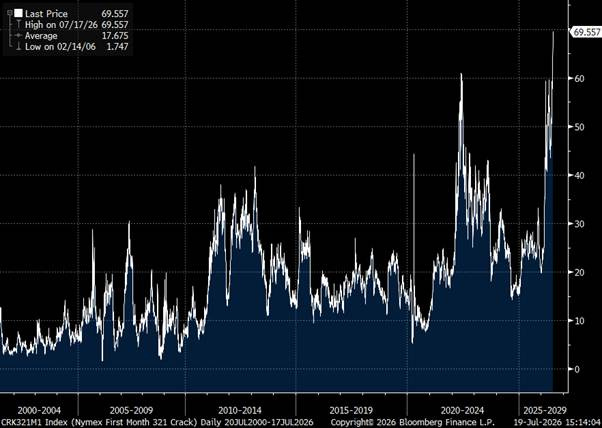
Just to show the scale of this move, the famous 321 crack spread (which has a nice long time series).. printed an all-time high this month. Not a post-2022 high. An all-time high.
So, European gasoline is commanding its biggest premium over Brent in four years. Gasoline futures are back within sight of their highs…
The shock, in other words, has become a refining story rather than a crude story. Which matters enormously for the inflation transmission, because, again consumers don’t buy crude. They buy products… and those are pricing a world far tighter than the Brent futures implies. Watching crude to gauge this shocks pass through is looking like the wrong instrument.
Putting this all together, its clear the supply shock is spreading and the cost pressure is broadening out. Be it from TTF, Crack spreads or Food prices. To me, it seems clear that inflation pressure are accumulating.
And its been showing up in far more than just energy prices… its already sitting in what would be considered the pipeline… PPI and import prices, which laid the foundation for 2022 inflation continue to run at levels that will inevitably drag consumer prices higher in my opinion.
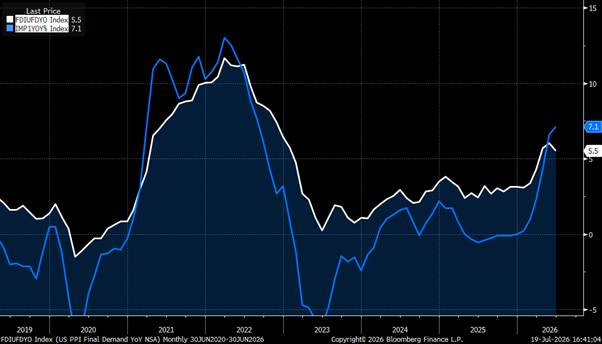
Macro Backdrop:
Of course, as this cycle persists. I will have to re-litigate the arguments that I made after the start of the War back in March. My view at the time was that, locally to the US, there were ample tailwinds to growth, and that the economy was expanding at a rapid clip. And that for those economies such as Europe, UK. Who leaned more on the Quantity adjustment than those on the Price side, had sufficient buffers in place (whether that was European fiscal, or UK savings) to weather and endure an external supply shock.
At a high level, I still believe that to be true. To a large extent I think I’ve been proven correct on that, as the severe pessimism that percolated in the immediate aftermath has not come to fruition. However, the inevitability of a recession will be stubborn in the minds of many. And no doubt having already been tested once, the shock absorbers are on the margin weaker than they were before.
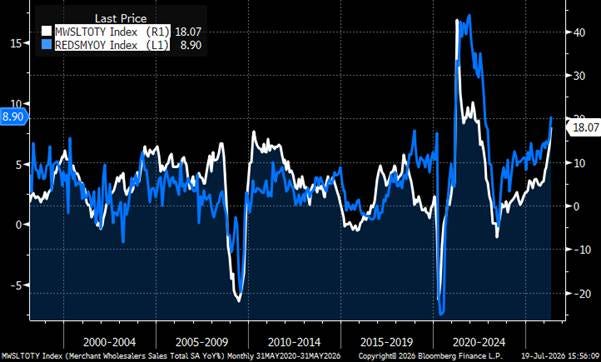
When focusing on the US, I continue to believe that the US is experiencing a nominal boom. There are of course a few engines to this… Fiscal deficits that are crazy, AI Capex spend that is filtering through the system, and for now these seem to be persisting. Against this is a healthy savings buffer and an immense wealth effect that is supporting these higher prices.
In nominal terms, I’ve liked tracking these two series so far this year which really exemplify the take off that we are experiencing. Redbook Retail sales & Merchant Wholesale sales. Both are nominal series.. Both of which are running at their fastest pace historically (ex Covid re-opening).
In the past month however, the two main, market relevant pieces of information in the US missed badly: NFP & CPI
NFP
Payrolls was soft, but soft in the way that invites over-interpretation.. The 3m trend points a touch lower, but sits comfortably above the breakeven.
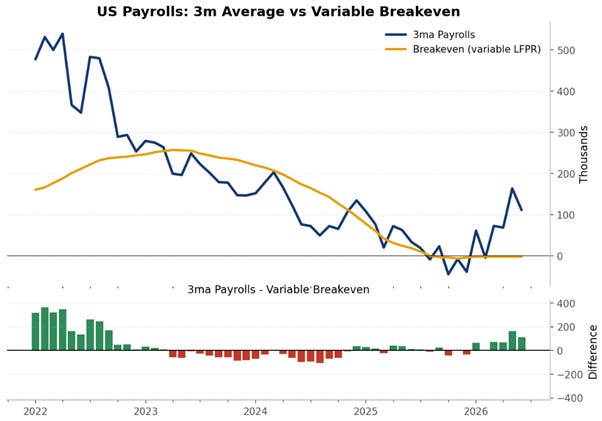
The headline U/E surprised lower. However this is almost fully due to the labour force participation rate dropping meaningfully… well, to be more precise, the LFP didn’t go up as much as a “typical June”.
The NSA series only increased 0.1%, and thus the SA series drops 0.3%, and so the headline U/E rate drops with it.
I’m trying not too read too much into any of that.. those who know me know my strong views on seasonal adjustments.. I’ll spare you the full sermon here, but hard to take much signal from this prior round of labour market data..
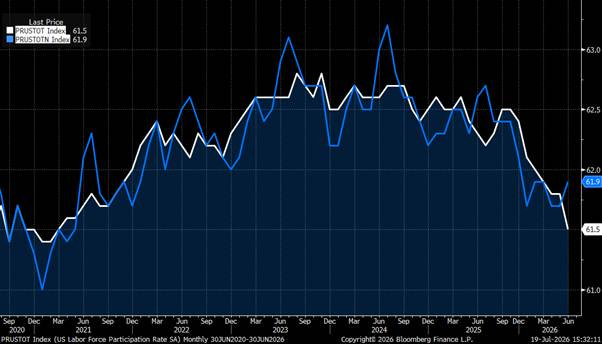
Labour Force Participation rate, SA(White)/NSA(Blue).
There has been, in fairness, a marked slow down in weekly ADP from ~40k back down to ~20k. Translating this into NFP is clear that perhaps the brief window of labour markets accelerating is behind us.
But it is way too early to suggest we are softening at a rate that is overly concerning. Other labour market measures, Claims/Jolts etc remain robust, and no warning signals as of yet. In any case, various Fed speak has told us that there is no real conflict between the two mandates currently. The labour market is on the back burner whilst price pressure percolate. To me we are nowhere near sufficiently loose, that even absent of seeing wage pressure, the Fed will still likely hike. But more on all that later.
But critical to this is that in the June SEP, not a single member saw the headline U/E rate decreasing this year.. I had been arguing that for July to be live, we needed the combination of 4.2% U/E, AND a 0.3% core… well…
CPI…
Now this recent CPI was an exceptionally tricky one for me. Impossible to really ignore, given the scale of the miss and the fact that Core CPI came in negative. The first outright negative Core since Covid…
However, it’s hard to say there was much “signal” in the print, its quite easy to identify lots of “noise”.
There is this little cared about statistical component of Inflation that really only the mega nerds care about. The “Common Component”..
It attempts to decompose an individual series’ reading from a common factor within the CPI basket, and strip out any idiosyncratic residuals.
In essence, we want to attempt to strip out an idiosyncratic move as they muddy the overall picture and try to isolate an underlying element to inflation.
In this last number, a lot of administered or inputed prices missed by an unreasonable amount (be that education, wireless telephone, apparel etc)... Thus, dragging the overall print lower. But the majority of items were internally consistent with one another.
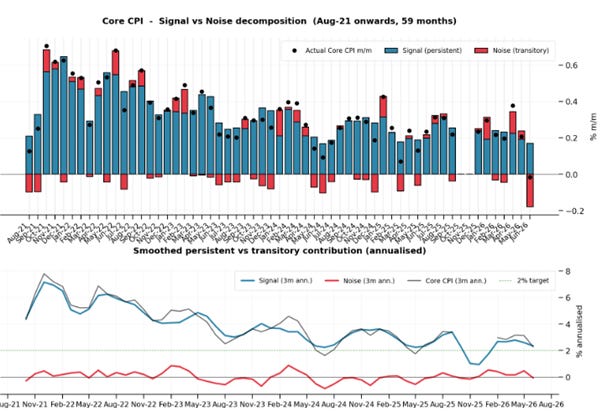
Analysing this CPI print, when using a Multivariate Core Inflation approach (akin to NY Fed) to decompose the inflation print into a signal and noise, we saw the largest negative “noise” contribution in 5 years.
I debated previously on the shortcomings of “Trimmed Mean” inflation as a raw measure. At that time, I wanted to present MCT inflation as a preferred alternative for us all to follow. Of course, the Fed already does, they just don’t talk about it that often.
Perhaps because it’s less intuitive. But it has plenty of benefits for policy makers and macro traders alike, so maybe it should become more in vogue.
But I can’t be too dismissive, the persistent element of core also started to decrease to a level more consistent with 0.2% m/m
In any case, when tracking into PCE, current estimates are for a soft 0.2% Core PCE. Which, if realised would shift the picture to one of moderate deceleration, albeit from a “too high” level.
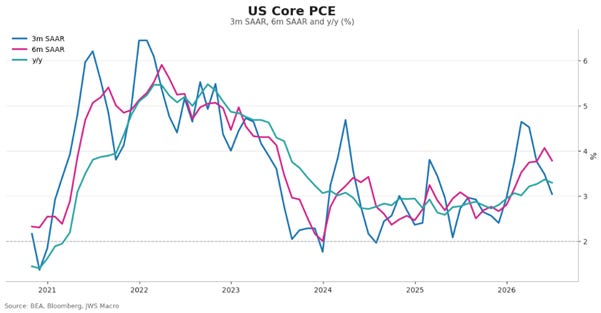
^ how momentum of Core PCE will look if we print 0.2%
In any case, fed speak has guided us in recent weeks.
How should we think about a string of 6 hot prints to CPI and then 1 soft print?
Waller, Warsh have both plainly said that the 1 miss is more likely the aberration. And whilst we can never know, chances are such that this will likely revert to a stronger momentum in the coming months. At which point they have openly said the will need to act.
Waller was more precise about the bar.. it would take several consecutive months of benign prints to keep the Fed on hold, not one.
It seems the asymmetry going forward is clear amongst the Fed and the hurdles to act are known.. if we don’t see a continued slowdown, hikes will be required.
So let’s look at the next CPI print, and what the current expectations are… and to me they are quite shocking still.
Looking at the July Fixing swaps on Friday, I saw the index trading around the 333.95/96 level. Exactly in line with the June print.
Now this trades NSA, but july is often the month with the closest NSA/SA residual (and thus lowest raw adjustment).
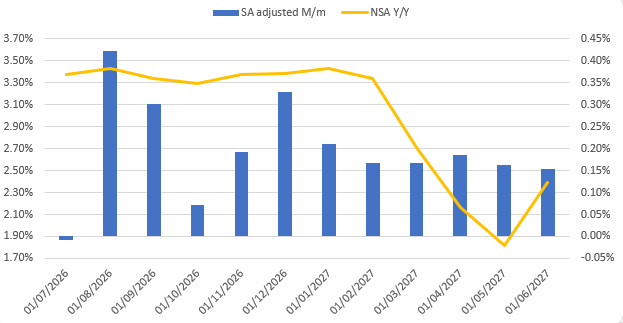
We get the next Print in the middle of August (12th). This will likely be the last remaining piece of information the FOMC needs before deciding September. Hence this will be critical (and one should own some gamma!).
Yet I find it strange that the Headline print can be trading for 0.0%.
Now , its clear there has been some weight added into Aug, Sep, with a 0.4,0.3% m/m respectively.. We are likely in the realms of far smarter people than me knowing how to day weight the July print based on Gasoline moves.
And perhaps its just a function that the average gasoline price sold on the forecourts lags a week or two behind the future (XB1), and thus this is merely a snapshot issue.
But Gas prices are up some 15% so far since the middle of june (1m rolling) and even if we stay here, or higher, should comfortably leave July average prices well above June. The residual thought of all of this is that the Market is assuming another exceptionally weak Core print, which I can’t personally believe. So I will scratch it down to timing peculiarities.. and that, even if we have seen a miss… even if we know the y/y print will likely have peaked and come lower.. the m/m prints are still uncomfortably high and the price level is rising!
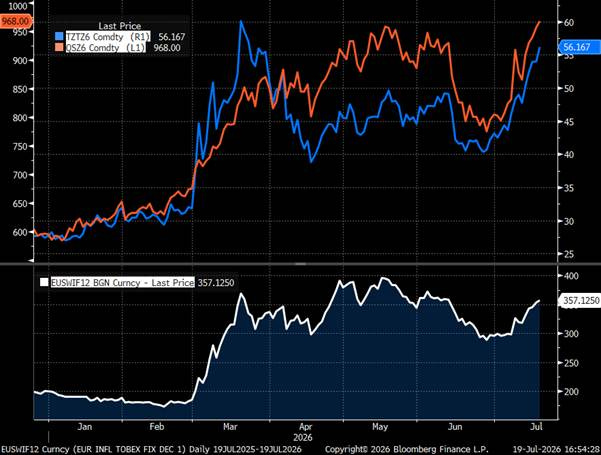
Not just in the US do inflation fixing feel a bit low to what we are currently witnessing in Commodity prices. In europe, as mentioned earlier, TTF + QS Z6 futures are functionally back at the years highs.
EU HICP dec26 y/y fixing is still ~50bps off the ceiling seen back in May. Ample scope for inflation to keep pushing higher, let alone if these commodities extend…
Risks to the view.. am I secretly long NDX?
Before I get to the more specific G4 Central bank views.. I want to briefly address the biggest risk to everything I’ve just written. And the honest form of the question isn’t “what if AI capex slows”.. it’s how much of my rates view is secretly a long-KOSPI view I haven’t marked to market?
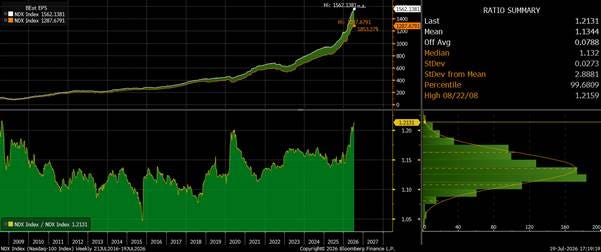
Nasdaq 2yr / 1yr EPS growth. 1y1y EPS in a sense… running at 21%.. highest in a long time. (Either a signal of 1) incredible nominal expansion 2) Productivity aiding the costs side of firms 3) insane level of expectations… or some mix of the three…)
Because if I’m paying rates partly because US nominal growth is booming.. and the boom is partly an AI capex and wealth story.. then some fraction of my rates trade is derived from the AI trade… And this month, Korea fell out of bed, the KOSPI down 30% from the highs, apparently over a million retail accounts facing margin calls, forced liquidations begetting more forced liquidations as equity IPOs/ADRs increased supply… US Semis/Hyperscalers all in turn followed.
For now, I think we can still ignore it as a macro event, and here’s the tell.. earnings didn’t miss. When fundamentals stay robust and price collapses, you’re watching positional excesses unwind, not a total demand break. Record margin balances, retail leverage, post-IPO supply, froth giving back… A deleveraging spiral..
For us in Rates, It can eventually become a macro event if its enough to either dampen the real economy flow via Capex, jobs etc.. or via a wealth effect mechanism.
On the former, I don’t quite see it being sufficient. That being said, the sheer number of anecdotal evidence I hear from my friends that work in other companies about the cost of AI usage getting a little unhinged is certainly worth noting…
On the latter… Sure, some hyper leveraged punters got wiped out. But Kospi is still up 65% YTD… NDX 15%... not sure we can argue for a negative wealth effect just yet…
Where does that leave me? A conditional, not a shrug.. the higher neutral view survives an AI wobble.. It does not survive an AI bust. If we do get a proper bust, the dot.com template says that paying rates, at least in the front end (based on fundamentals) can survive the initial equity drawdown. The Fed still hiked even after we saw the peak (not that we knew it then of course)… maintaining rates at tight levels for the best part of 9 months until we’d seen close to a 50% drawdown in NQ. Eventually though, gravity always wins.
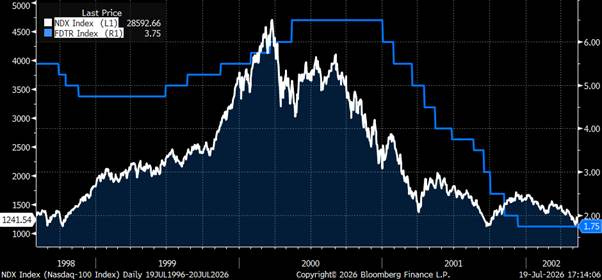
Hints of a changing nature to bonds were felt last week.. Sure, partly the X-Mkt unwinds.. and CPI “miss”.. but it was notable to feel how bonds become bid when Equities were looking decidedly vulnerable.. the old school correlations making a return?
One last point that I think matters. The Fed itself has openly started treating AI as a policy variable. We have previously debated how there has been a shifting of understanding around the policy implications of AI, from longer term negatives on the labour markets to near term positives, and longer term productivity enhancing disinflationary ideas towards nearer term cost and price pressures. There is no doubt however that, a continued AI expansion is a cornerstone to the higher neutral rate view. And as such a risk we must consider on every down tick in NQ.
But on to the G4 Central banks:
USD & the FOMC:
So starting as always with whats priced in.
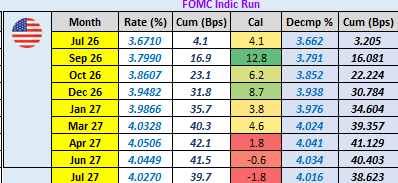
The first and most obvious debate is around July FOMC, given we start the blackout today. Warsh has clearly left his mark in pricing as there is no chance in a Powell fed, that the front month would be pricing as much as~4bps as we enter the period.
Universally, post CPI, the opinion was that “July is dead”. Of course, with such a miss this seems reasonable. Added to that the comments from Waller the day before priming us. It’s hard to argue that we saw the required data to deliver.
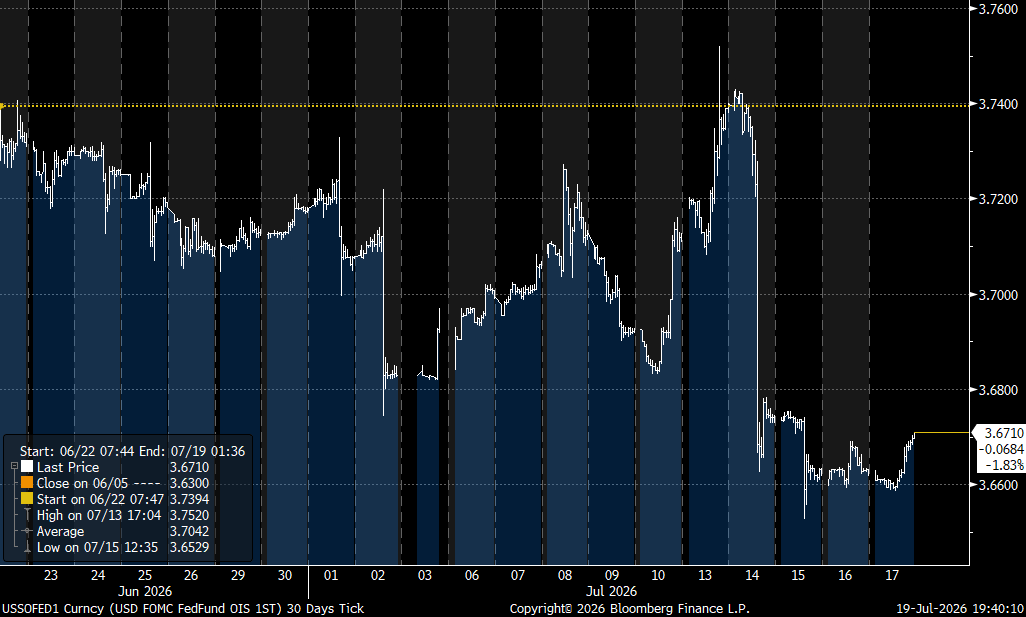
But that premium still exists for a reason. And it’s a thought that still niggles with me now… Can they hike in July?
It would serve a lot of the factions well to be honest.
A dove, who might be reluctant to hike at all, yet realising they seem inevitable may wish to bring forward that hike in the hope that we deliver less in total. Its likely true that the sooner they hike, the less they hike.. Somewhat compelling?
For the hawks. Well, it’s a hike. They will be happy.
For Warsh then, it certainly opens up his tenure with a bang. He has already warned us not to look at market pricing as a guide for policy action and there would be no stronger endorsement of his drop of Forward guidance, than to get on the board early.
This discussion very quickly drifts into the age old issue when debating central banking between “what I think they should do” and “what they realistically will do”.. arguably one of the hardest things to account for when playing central banks.. But in this new era , I really can’t dismiss it.
To be clear, I argued last time that I needed to see 4.2% U/E and 0.3% core.. and we didn’t. In an old framework, I should have conviction that July will be unchanged. I don’t though. And of course, I can choose not to bet on this meeting specifically, but it impacts any bet I have elsewhere, hence this is a very tricky moment.
Looking further out then, September and onwards towards the peak of the fwds. I think this is where the clearer value is. Sept is currently trading 50:50. Given the various comments out of the Fed, and my expectations over the near term path for inflation (and assuming NQ doesn’t puke 30%), I would be expecting to see the FOMC hike in Sept.
The next question is then how many? I had previously said I think we should be pricing somewhere 75-100bps into the curve, and I still believe that. With “just” 40bps out to next Apr, I see value in Paying whites (in some format or another).
I have long been arguing that neutral rates are higher than where most people are willing to admit. Last piece I suggested that they were around 4.1-4.15% (i.e where the fwd fwds meet).. I still think this is a reasonable level. Somewhere in the 4-4.25% range, and as such, if & when the FOMC decides to embark on a tightening cycle, I think we should land with policy above that. 3-4 hikes seems appropriate. The pace of which should be seen at a minimum of Quarterly, with risks to sequential if data continues to beat.
Perhaps then the micro value point in this curve is Oct gap. The Sep/Oct/Dec fly has a stubborn kink due to the midterms. Something that I do not believe should be relevant as we move into that window.
As we move out the curve, the next obvious point to consider is z6z7. A messy point, being driven by lots of offsetting factors.
Part of me looks ahead to how 2027 may materialise, with a marginally more dovish voter composition, and eventually a softening fiscal impulse, and think that if the Fed can tighten policy rates above neutral, then these fwd gaps should trade decently negative…
The other part of me, believing that we have plenty of nominal momentum and a repricing neutral rate should believe that we maintain some element of risk premium in these forwards and that the kink that we have should be ironed away with time. Given my conflicting views I try not to hold too firm a view to this segment.
Ultimately, these fwds are not meaningfully mispriced vs my expectations of neutral, and with Z7 ~4%. If the US continues to accelerate, I would expect we need to see tight conditions at some point, which may be 95.50 area (4.5%).
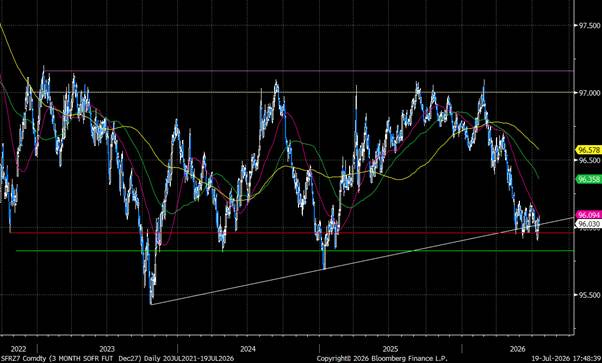
We have chopped around this level for the best part of 2 months. Critically, even with all the “good news” from Iran, SFRZ7 saw no real attempts to rally.
Lastly, to mention briefly on the curve. I had strong sympathies with Curve flatteners after Warsh last month, Seemingly along with the majority of the fast money community. They didn’t perform at all and steepened back out as the data missed in July. It feels to me this positioning is still there, with Shorts targeted in the very front, and longs in duration. When trying to think about the RV within the USD curve.. whilst I am very much bearish the whole curve, I do still believe that the Long end will outperform, and that the belly is most vulnerable. As mentioned last time, some concoction of 2s7s20s (paid7yr) with downside in the whites and a general short bias on rallies is how I want to play it. Nothing there has really changed.
EUR & the ECB:
What’s priced in?
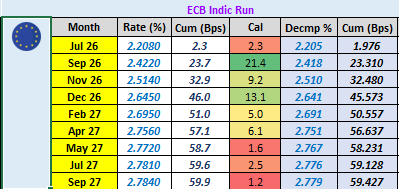
Lagarde is not Warsh. And the ECB is not the Fed. Even with very immediate concerns over energy prices a repricing of the inflation path. I struggle to see July being delivered. Notably after all the comments in Sintra (even if a world ago). But I personally don’t see the hurdle having been met for them to deem a “forceful” response. Far more likely is that she sets the expectations for September, placing the hurdle on what it would take for that hike “to not happen”.
The ECB has laid out its scenarios, and reaction functions quite clearly for the market to understand. And a Sept hike is still well within the neutral range estimates for policy. (1.75-2.5%). As such, in the mind of a policymaker, A “not adjustment” adjustment hike will be easily the prudent move given no such tightening is really taking place..
The far more interesting debate comes after. And this is still where I meet deep scepticism. I have argued in the past that I believed the 2027 gaps were vulnerable to this stubborn way of thinking, and I’m still yet to meet someone who truly believes the ECB may actually be starting a cycle of hikes that takes them to a restrictive stance. I believe this can look like 4-5 hikes in total, likely at a quarterly cadence, and into 2027.
My preferred exposure for this in the prior blogs was to pay the U7 meeting on the U6U7U8 fly, eventually looking for some number around ~50bps which felt like fair value to me.
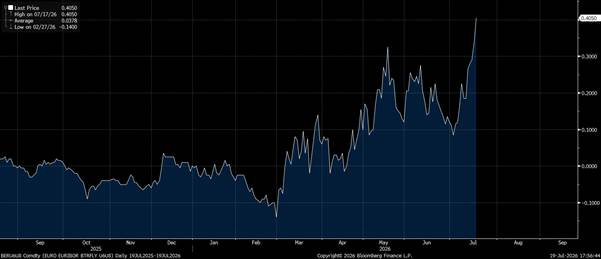
As of Friday we managed to reach 40bps. Getting there.
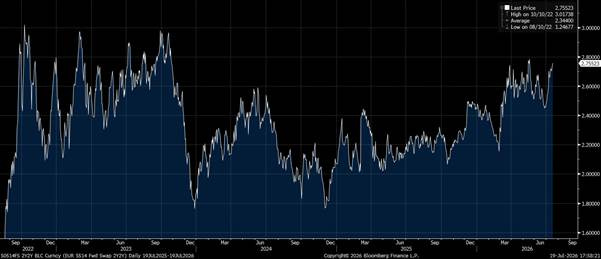
The other view I had, slightly more controversial was that EUR neutral rates were looking more like ~3% and that 2y2y rates could be more sustainably priced around that. Slow progress so far there, and lots of pushback, but at 2.75% 2y2y ESTR, I still see upside risks.
I had posted earlier on a chart of Dec HICP fixing, which had risen from ~3->3.5% in this recent energy move.
Comparing how the whole forward curve looks vs the ECB estimates (including the Milder) we see that we sit somewhat closer to adverse once again come year end.
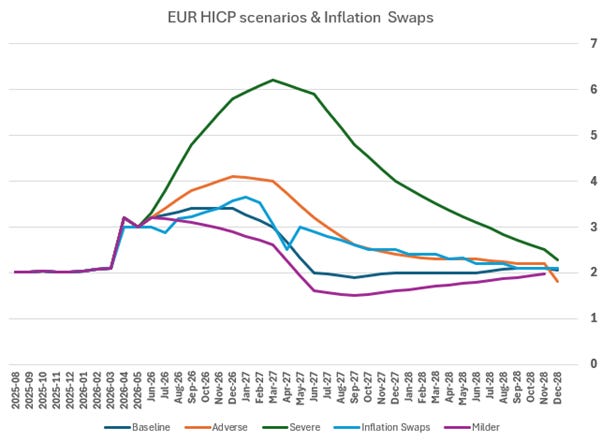
Of course, base effects and no visible signs of second round impacts really hit the profile next year and my preferred point to now observe is the April27 Fixing. An incredibly volatile point of course, but as it’s the “low point” next year, should frame the profile quite nicely.
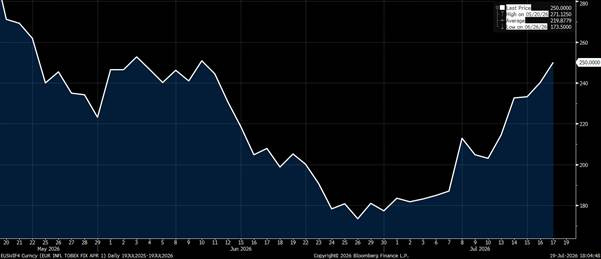
Since July began, we have repriced that low from 1.75%, up to 2.5%. Obviously if we can get ourselves back into a state of mind (and pricing) that sees HICP dropping to 1.7% and sitting below 2 come next summer. Then its reasonable to believe that Sept may be the last hike, and that cuts maybe priced from Dec27 onwards.
This is partly why I still like the fly exposure as I think regardless of how the next few weeks shake out, there is enough pressure in the pipeline that will prevent the ECB from cutting back for at least 9months.
EUR rates clearly exhibit a higher beta to energy prices, both fundamentally and due to the ECB reaction function.. and so the market will push these forwards around like feathers in the wind..
ERU8 is still in the midst of a bear flag formation. With levels that no doubt are attractive to the tactically minded faders..
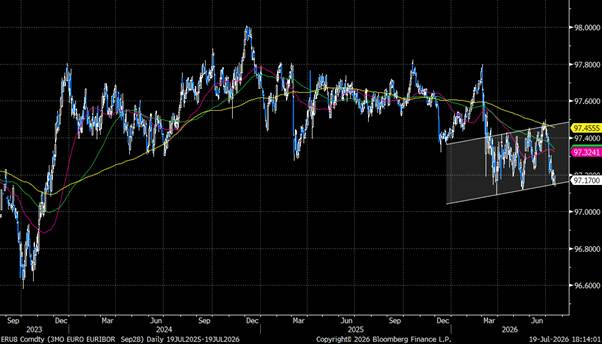
There’s not too much more to say specifically on EUR rates without opening up more topics such as ASWs in OATs/IK and the associated politics.. but in the interest of everyones time I won’t.
The risks mentioned in the start of this piece, focused around TTF, Food and products are incredibly important for Europe.
These risks are only growing, and as such I remain bearish.
It does feel like the market will stay incredibly stubborn, with the average Real Money PM still believing that any hike is a policy mistake and that the ECB will cut back as soon as its done.
I’ve tried, basically since the first blog post the War to give the arguments against this, and still see good chances that policy rates in Europe end all this on a 3 handle.
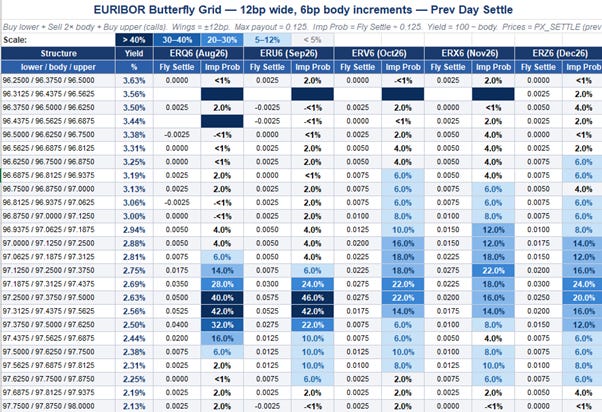
There is most weight around “1more hike” this year (pin .37 for a sep hike)... Then very little for further hikes… bimodal pricing again!
GBP and the BOE:
What’s priced in?
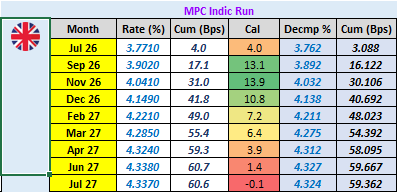
The BoE has the most room to surprise I think. Not just based on pricing, but purely as a function that I still don’t think I know anyone who actually believes the BoE will hike. We have CPI this week… unlikely to be fireworks but with such little priced the asymmetry is clear.
I have laid out my reasons in a prior post as to why I think the UK economy is in a “less bad” shape than most want to give it credit for. And that there is a structural and stickier inflation problem in the UK than in either Europe or the US.
We come into July, with a slowly creeping Vote share for hikes, but still seemingly not enough to trigger the hike.
With a shift from 0-9, 1-8, 2-7, and external conditions showing no obvious let up, then pressure will be on the committee to start acting.
I still believe that Bailey has set the groundwork for his undoing by being overly dovish so far, linking his pausing to “active policy decisions”. As things stand, the path for CPI will still accelerate into the end of the year, at critically vulnerable times when it comes to wage setting and second round impacts for 2027.
September gap is gaining weight in the sell off but the market still has no strong opinion (or guidance) on when a hike could come… the forwards are just getting dragged up and Sep/Nov/Dec are just equally taking it.
UK: Dec RPI fixings vs FNZ6 (UK nat gas)…
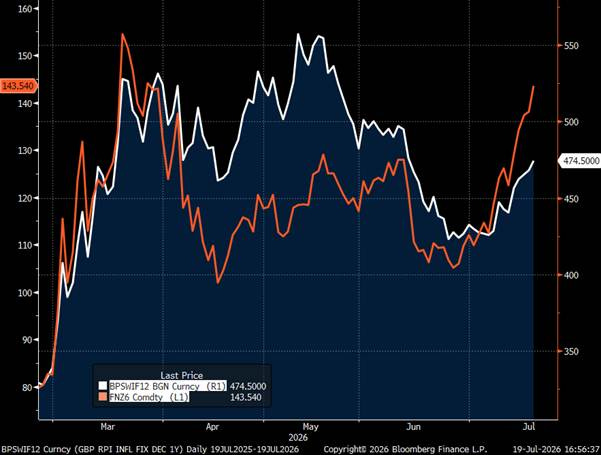
The disconnect between Oil and Gas prices is most evident in the BoE April forecasts. Whilst we are lower than scenario B for Oil… We are comfortably higher than B, approaching C , for Gas. We all know that the transmission mechanism is not straightforward, and both blessed and cursed by the OFGEM lags, but it becomes harder and harder to ignore.
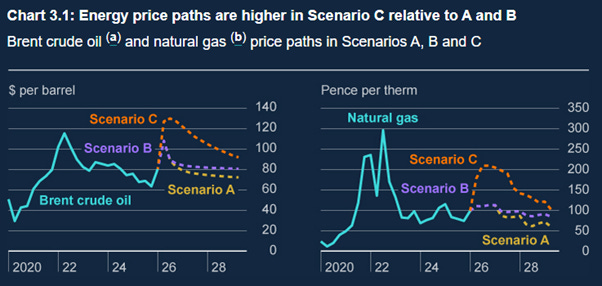
And even as I acknowledge that there is clear slack in the labour market, with diminishing pressures on wages.. it may not be enough for the BoE to simply stand still (especially as we have 50bps of hikes priced) and thus are passively easing into this.
A trade I loosely toyed with a while back was to pay July BoE and Rec ECB for flat (+1). Whilst it has done absolutely nothing since, and hopes are still incredibly low for this to play out, given we have a new round of forecasts coming and a QIR, there is still chance.. More likely however, much like with the ECB, is Bailey can lay out the hurdle that we would have to see across August “To not hike”. Increasingly this is becoming the theme and narrative that I am seeing in these Central banks.
Given the shock has persisted this long, and given ample uncertainties still remain, you either need to see a clear and obvious downside shock to growth (which none expect!) or some more tangible end to the conflict (which doesn’t seem particularly likely to me!). Yes there will be headlines and head fakes, but as we saw with the MoU drama, Central banks thought this bought them time to not act, but in fact likely catches them increasingly off side.
The much trickier question for UK is two part: what to do in 2027. And whilst sure, Iran etc matters for that (I hope we are not still talking about it next year!), for the UK, domestic politics is always the bogeyman that lingers. Burnham thus far has been making all the right sounds. Rumoured to be starting North sea Oil again, avoiding Milliband as chancellor… Doing all the things a savvy political operator should be doing in order to quickly and confidently build credibility… What he spends that on in the future, is anyone’s guess.. I struggle to position or even think that far ahead still. And so its best to avoid strong views..
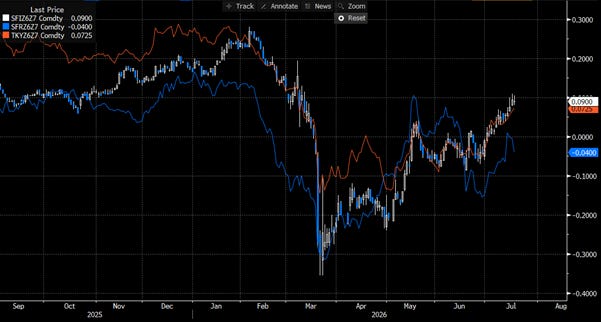
Z6z7 amongst EUR, UK, US.. Sonia is still marginally the steepest..
The market, even having been punished twice this year using GBP as its long. Will no doubt go back to it in very short order. We have 60bps priced to the peak of the fwds, and even as a bear, its hard to see >3 hikes delivered in the coming year. Of course, pricing and delivery are two very different things.. but the market will not give up on Sonia longs, and even if they go through a violent stop out again… And as i learnt last week in France whilst looking after my 3yo niece and 2yo nephew, there is no greater human force than FOMO..
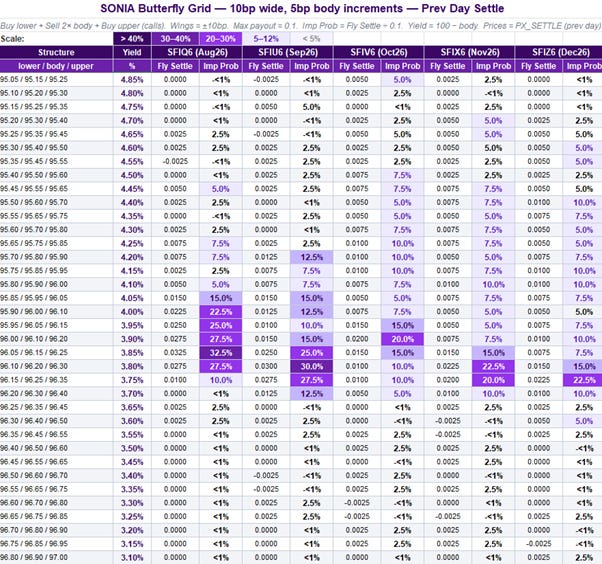
At least this time around, the market is not keen to sell the puts to fund all the pin Unch Call flys that have gone through. For now, even with hefty pricing in the fwds, the 96.25 pin is still the most popular / rich. Amazingly some Cut premia by Z6…
JPY and the BOJ
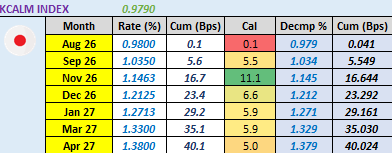
I had tried to argue last time around there was an outside chance that September may see the next policy shift higher from the BoJ.. Once again though, as military conflict looms, and whilst the Nikkei is struggling to churn through frothy price action, one has to expect the BoJ to lean more towards the dovish side than hawkish. Again leaning on Growth fears rather than Core CPI concerns.
At a top down macro level. There is unfortunately nothing new to discuss with Japan. The current stance of sitting “just behind the curve”, whilst showing no imminent signs of tightening is serving to keep the longer term trends in tact… JPY weakness and JGB steepening.
However, the longer this persists the greater the eventual hiking will be “just to avoid easing”
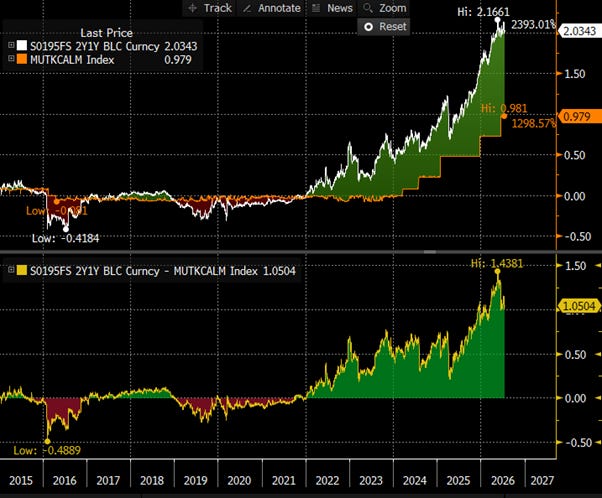
2y1y vs policy rates
The only relevant story in this period has been the political pressure from Katayama and Taikachi on the GPIF to increase allocations towards domestic bonds. This has got the ultra long end quite excited, but it misses a few things:
The MoF nor Takaichi can actually enforce this. GPIF can already increase allocations within a band, but set those rates only last year and that’s not up for review for another 2 years.
And EVEN if they were to reallocate. Its not clear that they would even focus on the long end of the curve as many are excited about. The Current GPIF domestic bond portfolio sits around ~5y, and with ample issuance, they could easily sit near the front of the curve and build up allocation that way. Now, perhaps with long end yields ~4%, their internal return calculations can shift up the risk allocation..
given duration risks at that rate, 5y ~2% probably screens as better risk reward to them.. at least while the Govt that is at one time telling them to buy more, is at the other time yeeting more and more via fiscal expansion.
And after all that, even a modest few % allocation increase, is unlikely to structurally change the trend. All in all, I think it’s a bit of a red herring of a narrative. Sure, 10y10y JPY is at some crazy levels, but for me, until the rot is addressed (i.e fiscal profligacy and BoJ looseness) then these may be tradable 30-50bp swings, but nothing more.
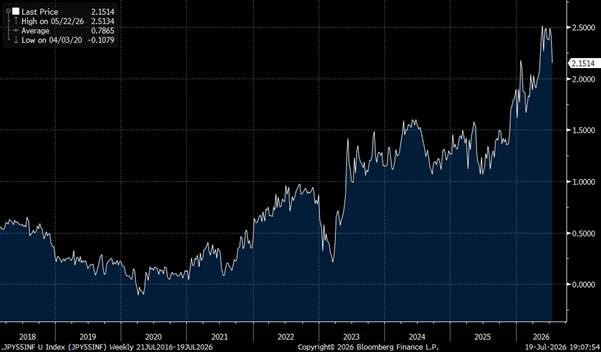
The general flattening has compressed term premium enough that its even managed to bring down 5y5y inflation swaps somewhat. Whilst still above 2%, its well off the 2.5% levels we have been.. However, notoriously illiquid and levered in nature , so I will not take much signal from this.
The JPY STIR market is seemingly pretty confident that the next realistic shot at tightening comes in Nov. No reasons really to fade this. Without immediate pressure on the JPY towards 170, Sept now seems unlikely and so ideas such as 2x Sep vs 1x Nov will become enticing (so long as you have the USDJPY call to hedge!).
Rates: Relative Value?
Front end pricing is quite interesting now, and here’s a question I’ve posed to many people in this past week.
Lets just imagine for a second, that the front meeting in all these CBs are priced to 5bps. (Sept is the front meeting for the BoJ for this Q). (there was a moment they were all the same hence the Q..)
In what order, or conviction, do you place these from most, to least likely to hike?
I have been shocked at the range of answers I received, some the exact opposite to me.
On my part: I think, in order of most to least.. For the same 5bps pricing.
1. Fed
2. BoE
3. ECB
4. BoJ
Now, thinking further out the curve.
Out to 1yr: Imagine all 4 G4 curves are pricing the same 50bps (Ok they are not quite, but its close!) How does your conviction look? For me:
1. Fed
2. BoJ
3. ECB
4. BoE
With such coincident pricing, Rates RV is surely going to be fun for the next year!
Wrapping up.. same north star, worse weather.
I’ve deliberately not tried to write a big new thesis this piece. The north star from #6 hasn’t changed.. higher neutral still seems like the destination, and the supply shock, now almost 5 months in, will lead to Central Bank tightening.
The shock isn’t fading, its broadening out.. TTF is trying to clear three crises at once. Wheat and Ags has flipped from a drag to an accelerator... Energy products are basically at the highs with no sign of easing, and inflation swaps are only just starting to notice… PPI and import prices have shown you inflation has been accruing all this time.. and to me its only a matter of time until we see more tangible evidence in consumer prices.
For the CBs, perhaps this escalation comes too soon for July, but September is live everywhere it matters. Fed underpriced for the cycle. ECB priced for two and done when its more like 3 to 4 more... BoE the most stubborn curve I follow given the votes are drifting under a Governor who has boxed himself in. BoJ still leaning dovish on purpose letting the pressure valves of the currency and curve do some of the work..
And as Central banks have tried to buy time & the straits close down again. The risk of falling behind the curve start to compound with time.
Still bearish rates.
As always, thoughts & pushback welcome. Thanks for reading!
JWS
Terrific note!
Thank you JWS for another great piece. An awesome read.
One question on your Butterfly Grids, if you don't mind (they are very cool).
Is it fairly 'simple' to keep an excel file updating those prices via BBG? or is this something you built with a different data provider?
Not sure if BBG options data for these contracts is good enough, and would love to learn.
Thanks again!
Best,
Valentino